
 How to Choose the Right Medical School Based on 2023–2025 Data
For non-EU students who want to study medicine in English in Italy, IMAT is not just an exam. It is also a matter of application strategy. The biggest reason is simple: non-EU applicants are allowed to choose only one university.
In this system, no matter how high a student scores, they are evaluated only for the university they selected. If they do not reach that school’s cutoff, they cannot be admitted elsewhere, even if their score would have been enough for another university. That is why, for non-EU students, the real question is not only “What score do I need?” but also:
“Which university should I choose?”
In this article, we use data from 2023 to 2025 to examine English-taught public Medicine and Surgery programs in Italy from a non-EU perspective. The goal is to make school choice more accurate, more strategic, and more data-driven.
 Why are we only looking at 2023–2025 data?
This analysis focuses only on the last three years for an important reason.
Until 2022, the IMAT exam was prepared by Cambridge. During that period:
- the question format was different,
- the distribution of questions by subject was different,
- and the exam structure was not directly comparable to today’s system.
For the last three years, however, the exam has been prepared directly by the Italian Ministry of Education. By 2025 in particular, the structure of the exam appears to have become much more consistent. That makes the 2023–2025 period a much more relevant and reliable reference point for today’s applicants.
The dataset used in this article includes three core variables for each university:
- cutoff score
- number of non-EU applicants who chose that school
- quota
This analysis focuses only on English-taught public Medicine and Surgery programs for non-EU applicants. Dentistry, Veterinary Medicine, and special-category seats were excluded to keep the comparison consistent.
 Why is school choice so critical for non-EU applicants?
While the system can be more flexible for EU applicants, the situation is much more straightforward for non-EU students: they have only one choice, and that choice can determine everything.
That is why choosing the wrong school does not simply mean making an ambitious decision. It also carries a very real risk:
- the student may get a good score,
- that score may be enough for other universities,
- but if it is not enough for the chosen school, the student is not admitted anywhere.
So for non-EU applicants, choosing a university cannot be based only on “the best university” or “the city I like most.” It has to be evaluated together with competition level, application pressure, and quota size.
 What question is this analysis trying to answer?
The core question behind this article is:
How can a non-EU applicant use 2023–2025 data to understand which schools are riskier, which ones are more balanced, and which ones are more vulnerable to sudden surges in demand?
To answer that properly, you cannot rely on a single variable.
Looking only at the cutoff score is often misleading. Looking only at the number of applicants or only at the quota is not enough either. To understand the real picture, these three variables need to be read together.
 Why looking only at cutoff scores is not enough
A school may have a relatively low cutoff in one year. At first glance, that can make it look more accessible. But if that same school attracts many more applicants the following year, its cutoff may rise unexpectedly.
Likewise, a school may have a large quota. That sounds like an advantage, but if the school is also attracting significantly more applicants, that advantage can quickly disappear.
That is why the most meaningful way to read the data is to consider these three variables together:
- cutoff score
- number of applicants
- quota
Once these are combined, the university’s real competition profile becomes much clearer.
 The key indicator: applicant-to-quota pressure
Across the dataset, one of the most revealing indicators is the applicant-to-quota ratio — in other words, competition pressure.
A school having 300 applicants does not tell you much on its own. What matters is whether those 300 applicants are competing for:
- 15 seats,
- 30 seats,
- or 60 seats.
That is where the real difference appears.
So when choosing a school, applicants should not focus only on “which universities are popular,” but also on how much demand is being squeezed into how many seats.
The big picture: growing interest, more complex competition
The 2023–2025 data clearly suggests that interest in English-taught medical programs in Italy is growing. Many universities show an increase in the number of non-EU applicants. Over the same period, the Italian Ministry of Education has increased quotas at some universities, but in most cases that increase has not been enough to fully offset the growth in demand.
For example:
- Luigi Vanvitelli goes from 615 applicants in 2023 to 913 in 2025.
- Parma jumps from 268 applicants in 2024 to 798 in 2025.
- Marche rises from 348 applicants in 2024 to 477 in 2025.
At the same time, some schools show declines or fluctuations:
- Padova drops from 274 applicants in 2024 to 175 in 2025.
- Bicocca falls from 125 to 89.
This tells us something important:
overall demand may be rising, but not every university is moving in the same way.
That is exactly why school-by-school analysis matters.
Does higher competition pressure usually mean a higher cutoff?
In general, yes. When the data is viewed as a whole, schools with higher applicant-to-quota pressure also tend to have higher cutoff scores.
Some strong examples include:
- Pavia reaches a 73.0 cutoff in 2025 with 557 applicants and 35 seats.
- Milano Statale stays at 72.9 with 171 applicants and 15 seats.
- Bologna produces a 70.3 cutoff with 224 applicants and 20 seats.
By contrast, schools with lower pressure tend to remain at lower cutoff levels:
- Cagliari is at 54.2 in 2025 with 102 applicants and 20 seats.
- Bari is at 49.3 with 43 applicants and 11 seats.
That said, the relationship is not perfectly linear. At some schools, demand may rise without producing the same increase in cutoff. At others, even a limited increase in demand can have a sharp effect. So these numbers show a strong pattern, but not a guarantee.
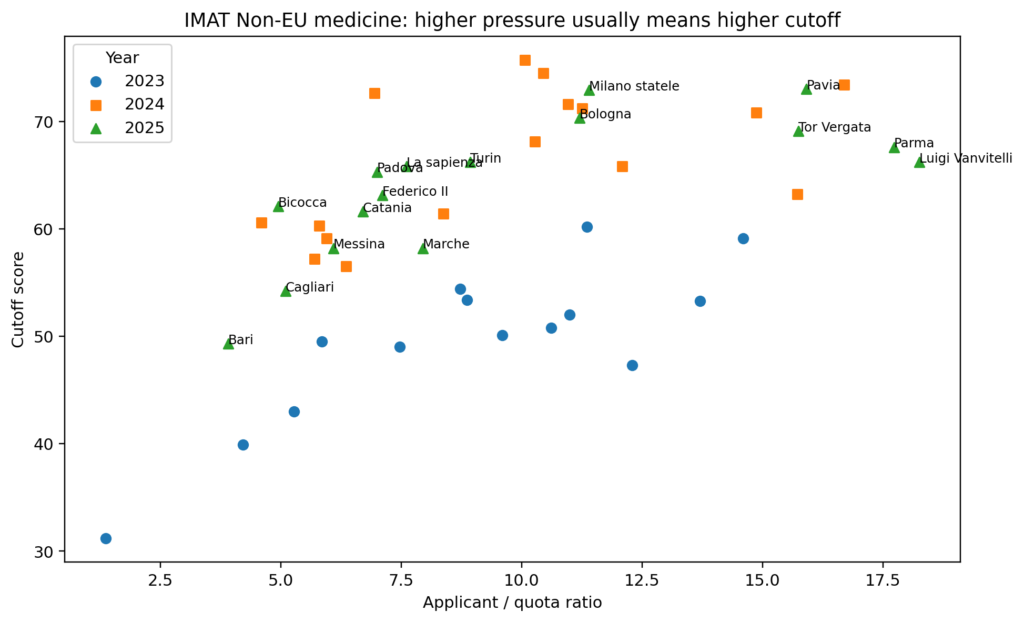
As the applicant-to-quota ratio rises, cutoff scores also rise at many schools. That is why non-EU applicants should look not only at cutoff scores, but also at competition pressure.
Which schools fall into which group based on 2025 data?
Looking at 2025 cutoff scores, the most competitive upper group includes:
- Pavia – 73.0
- Milano Statale – 72.9
- Bologna – 70.3
- Tor Vergata – 69.1
- Parma – 67.6
- Turin – 66.2
- Luigi Vanvitelli – 66.2
- La Sapienza – 65.8
- Padova – 65.3
The middle band includes:
- Federico II – 63.1
- Bicocca – 62.1
- Catania – 61.6
- Marche – 58.2
- Messina – 58.2
The lower band includes:
- Cagliari – 54.2
- Bari – 49.3
The key point here is this: this is not a list of the “best universities.” It is more useful to read it as a map of competition levels.
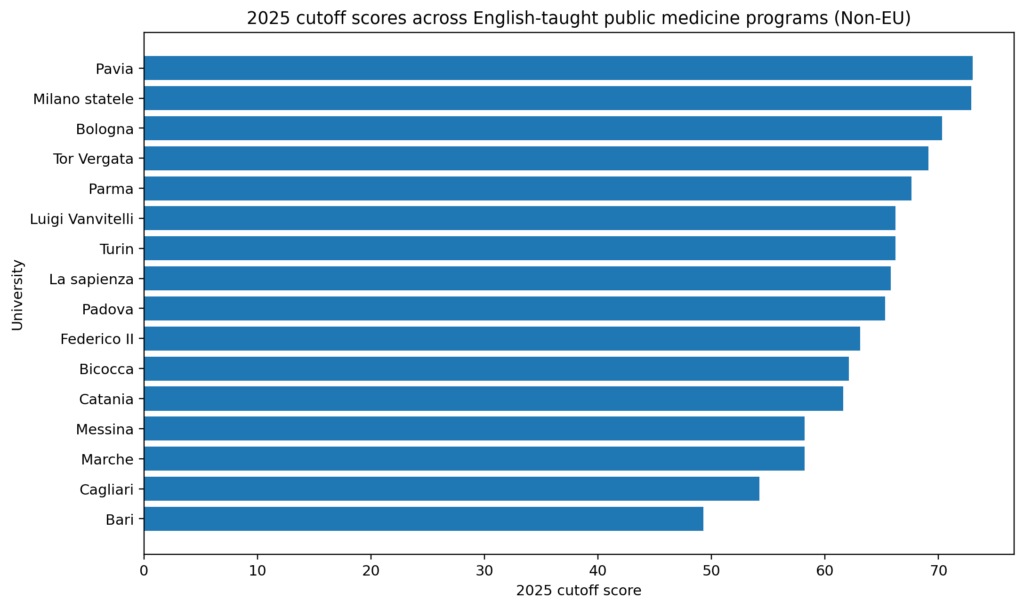
The 2025 cutoff distribution shows the relative competition level of each school and offers an important framework for building a smarter application strategy.
The most striking movements over the last three years
Parma: the clearest example of how demand can push cutoffs sharply upward
At Parma, the cutoff rises from 59.1 in 2024 to 67.6 in 2025. Over the same period, the number of applicants jumps from 268 to 798 while the quota remains fixed at 45. This is one of the clearest examples in the dataset of how a surge in demand can dramatically raise the cutoff in just one year.
Tor Vergata: even a quota increase may not be enough if demand surges
At Tor Vergata, the cutoff increases from 60.6 in 2024 to 69.1 in 2025. The number of applicants rises sharply from 69 to 315, while the quota increases from 15 to 20. What makes this case striking is that even though the quota went up, the increase in demand was still strong enough to push the cutoff much higher.
Padova and Bicocca: when demand falls, cutoffs can ease
At Padova, the cutoff falls from 71.6 in 2024 to 65.3 in 2025, while applicants drop from 274 to 175. Bicocca shows a similar pattern, with both applicant numbers and cutoff scores falling. This suggests that at some schools, competition pressure can directly shape the cutoff level.
Bari: one of the most volatile profiles in the dataset
Bari stands out as one of the most unstable schools across the three-year period:
- 2023: 31.2
- 2024: 65.8
- 2025: 49.3
Sharp swings like these show why relying on only one year’s cutoff can be risky.
 What should non-EU applicants pay attention to when choosing a school?
1. A low cutoff does not automatically mean a safe choice
A school that appears more accessible in one year may become much harder the next year. Demand, city preference, and changes in perception can push cutoffs higher very quickly.
2. A large quota matters, but it is not enough on its own
Schools like Messina, Marche, and Federico II benefit from larger quotas, which can create a buffer. But if many more applicants start targeting those same universities, that advantage can shrink fast.
3. Highly demanded or highly reputable schools leave less room for error
Schools such as Pavia, Milano Statale, and Bologna already attract strong demand. At these universities, even a small miscalculation can be costly, because the non-EU system does not offer a safety net.
4. Volatility is a real risk factor
Some schools move much more sharply from year to year. In those cases, looking at only one cutoff can be misleading. That is why reading the full three-year pattern is much more useful than relying on a single number.
Rankings should not be ignored entirely
This analysis is not built directly on ranking data; its main framework is based on cutoff scores, applicant numbers, and quotas. Still, in practice, a university’s international visibility, academic reputation, city appeal, and general ranking perception can also shape applicant behavior. At some universities, changes in demand are easier to understand when reputation and visibility are considered alongside the numbers. In other words, rankings are not the core variable in this analysis, but they can still act as a secondary factor that indirectly strengthens application pressure.
What is the healthiest way to read these schools?
Based on the three-year data, it makes sense to think about the schools in three broad profiles.
High-competition group
Pavia, Milano Statale, Bologna, Tor Vergata, Padova, Turin, and La Sapienza tend to produce higher cutoffs and stronger competition. In this group, even relatively small shifts in demand can matter a lot.
Middle band, but still requiring caution
Federico II, Bicocca, Catania, Parma, and Luigi Vanvitelli offer both opportunity and risk. When applicant numbers change quickly, these schools can move in unexpected ways.
More accessible on paper, but still worth watching closely
Messina, Marche, Cagliari, and Bari belong to the lower-cutoff group. But that does not mean they are automatically safe. If they begin to attract many applicants as “strategic fallback choices,” they can also experience sudden pressure.
 Final takeaway: What is the smartest approach for non-EU applicants?
The 2023–2025 data sends a very clear message:
For non-EU applicants, school choice is just as strategic as the score target itself.
In a system where you only have one choice, selecting the wrong school can mean failing to secure admission even with a good score. That is why the right approach is not to judge universities only by last year’s cutoff.
A better approach is to:
- look at the three-year cutoff trend,
- track how applicant numbers are changing,
- assess how well the quota absorbs that demand,
- evaluate applicant-to-quota pressure,
- and account for volatility.
In short, for a non-EU applicant, the right choice is not simply the school they want most. It is also the school that is most realistic in light of the data.
![]()